1. Business Details
Rolling Beans is a mobile espresso cart business operating within the hospitality industry in Whangarei, Northland. Founded by Paula Bean as a sole trader, the business is established in August 2026 with the purpose of bringing quality, barista-crafted coffee directly to market shoppers and event attendees across the region. Operating under a mobile setup rather than a fixed premises, Rolling Beans trades primarily at the Whangarei Growers Market, with plans to expand into additional Northland markets and private event catering as the business grows.
Paula identified the opportunity firsthand while attending the Whangarei Growers Market and noticing the complete absence of coffee on offer — a straightforward gap given the volume of foot traffic and the time shoppers typically spend on-site. That observation became the foundation for Rolling Beans. Paula currently operates the business part-time as the sole team member, handling all aspects of trading, customer service, and administration herself. The business maintains an online presence through its website at rollingbeans.co.nz and across Facebook and Instagram under the handle Rollingbeans. Rolling Beans holds a registered logo as its intellectual property and meets all relevant legal obligations applicable to mobile food and beverage vendors in New Zealand.
2. Market & Customers
The market Rolling Beans can realistically reach is defined not by New Zealand's coffee industry at large, but by the weekly foot traffic flowing through the Whangarei Growers Market and the broader local events calendar across Northland. Whangarei's district population of approximately 96,000 supports an active weekend market culture, and regular attendees of the Growers Market represent a captive, recurring audience — adults who already spend an hour or more on-site with discretionary money to hand and, until now, no coffee option available to them. Conservatively serving 150 to 250 customers per market day at an average price of around $5.20, Rolling Beans is forecasting annual revenue of just over $41,600 in its first twelve months, which reflects a grounded and achievable slice of local demand rather than an outsized projection.
The competitive landscape is more nuanced than it might first appear. Established CBD cafés such as Caffeine Whangarei carry genuine strengths — loyal customer bases, consistent quality, and a comfortable environment that many locals actively seek out. Supermarket kiosks benefit from habitual foot traffic and price accessibility that should not be underestimated. Night market vendors bring experience operating in outdoor conditions and have already built rapport with recurring crowds. Even the habit of arriving at the market with a travel mug from home represents real competition, given that it costs nothing and requires no queue.
Where Rolling Beans competes effectively is on location and timing. None of those alternatives are present at the Growers Market at the moment a shopper wants coffee. The business does not need to be better than every café in Whangarei — it simply needs to be there, delivering a genuinely crafted espresso, at the place and moment no one else is.
3. Vision & Position
Vision
By 2027, Rolling Beans will be the most popular mobile coffee cart among Whangarei coffee lovers, recognised for bringing genuine café-quality espresso directly to the people who want it most.
Position Statement
For people who want a great coffee while shopping, Rolling Beans is a skilled mobile barista service that satisfies any caffeine fix — right where customers already are, without asking them to go out of their way.
Values
Rolling Beans operates according to three core values:
- Quality and freshness — every cup is made with care, using quality ingredients and proper barista technique
- Value for money — customers receive a genuine café experience at a fair and accessible price
- Convenience — coffee comes to the customer, fitting naturally into their existing routine rather than interrupting it
4. Goals & Achieving Them
Goal 1: Secure exclusive vendor status with Whangarei Growers Market organisers within the next three months
Paula will research and directly contact the Whangarei Growers Market organisers to request a formal meeting, presenting a professional vendor proposal that demonstrates Rolling Beans' unique value and the customer benefit of having quality coffee on-site. A pitch deck built using Canva or Google Slides will outline the brand, equipment setup, and a fee or revenue-sharing structure designed to make the exclusivity arrangement attractive to organisers. A budget of $200–$500 is anticipated for branding materials and a trial market day to demonstrate operational readiness, and engaging a local business advisor experienced in vendor negotiations would meaningfully strengthen the pitch.
Goal 2: Launch a loyalty stamp card targeting 50 repeat customers within the first two months of operation
Rolling Beans will design and print a simple double-sided stamp card offering a free coffee after eight purchases, launching it from day one by personally handing a card to every customer alongside a brief explanation of the reward. Redemptions will be tracked weekly to measure progress toward the 50-customer target, with the reward threshold adjusted if uptake falls behind. A budget of approximately $50–$150 for a local print run through a Whangarei supplier such as PaperPlus or Snap Print will cover the cards, and a free app like Stamp Me or a simple tally sheet can manage tracking without added complexity.
Goal 3: Book four paid private or corporate catering events per month to reduce weather-dependent cash flow risk
Paula will develop a concise corporate catering pitch package comprising a pricing menu, setup photographs, and a one-page capabilities sheet, then personally reach out to 10–15 local Whangarei businesses, event planners, and function organisers who regularly host staff events or client gatherings. A limited-time introductory offer will be used to incentivise first bookings, and satisfied market customers will be encouraged to refer Rolling Beans to their workplaces. A budget of $200–$400 for printed materials and a basic digital portfolio is anticipated, along with a commitment of three to five hours per week to outreach and relationship-building through networks such as the Whangarei Chamber of Commerce.
Goal 4: Expand to two additional Northland markets by end of year, increasing weekly revenue days to three
Paula will contact Northland market organisers directly — with Kerikeri Farmers Market and Dargaville Market identified as strong initial candidates — to request vendor applications and review availability schedules. Before committing to any additional market, foot traffic levels, vendor fees, and scheduling conflicts with the existing Whangarei commitment will be assessed to confirm financial viability. This goal is achievable primarily through Paula's own time, estimated at three to five hours of research and applications, with a modest budget of $50–$150 set aside for any upfront application or registration fees.
Goal 5: Build a three-month operating cash reserve to protect against licensing changes, price rises, and bad weather
Paula will open a dedicated business savings account and automate a fixed weekly transfer equivalent to 20–30% of each market day's takings, removing the reliance on willpower and building the reserve steadily over time. Average weekly revenue will be tracked over the first four to six weeks to calculate a realistic monthly operating cost figure, giving the reserve a concrete dollar target to work toward. Free tools such as a spreadsheet or a low-cost app like Xero or Wave will manage cash flow monitoring, and introducing a pre-paid coffee bundle — for example, ten coffees purchased upfront at a small discount — could provide lump-sum injections to fast-track the reserve.
Team & Resources
Rolling Beans currently operates as a part-time sole trader with Paula Bean as the only team member. No new hires are planned at this stage, meaning Paula manages all operations, customer service, and outreach personally. Specific marketing support has not yet been detailed and will need to be decided as the business develops. The goals are estimated to contribute an additional 2,002 sales units over the forecast period. Individual goal costs have been identified within each goal above but have not yet been estimated into the financial forecast.
5. Financial Position
Opening Position
Rolling Beans begins trading in August 2026 with an opening bank balance of $5,000, total assets of $20,000, no debt, and equity of $25,000. This is a lean but solid foundation for a sole trader mobile operation, with no loan repayments placing pressure on early cash flow.
12-Month Forecast
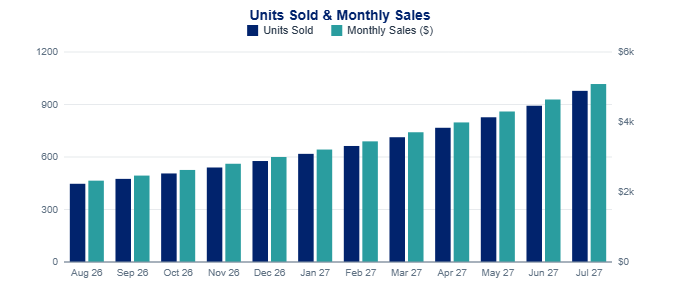
The forecast runs from August 2026 through July 2027, generating annual revenue of $41,621 across 8,004 units at an average selling price of $5.20 per cup and an average unit cost of $1.30. Monthly revenue rises consistently across every month of the forecast period, from $2,324 in August 2026 to $5,086 in July 2027, with no dips or flat patches in between. This reflects steady growth rather than a seasonal curve.
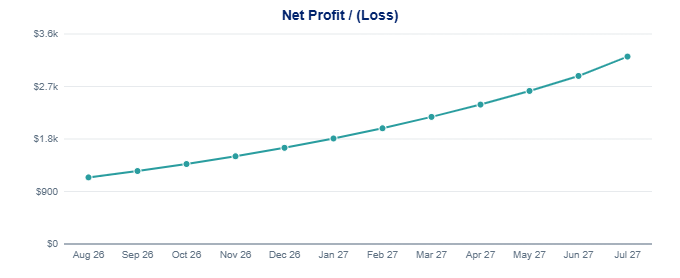
Monthly net profit follows the same upward trajectory throughout the year, climbing from $1,142 in August 2026 to $3,214 in July 2027. Annual net profit totals $24,004, representing a healthy margin for a single-operator mobile business with minimal fixed overhead.
Cost Drivers
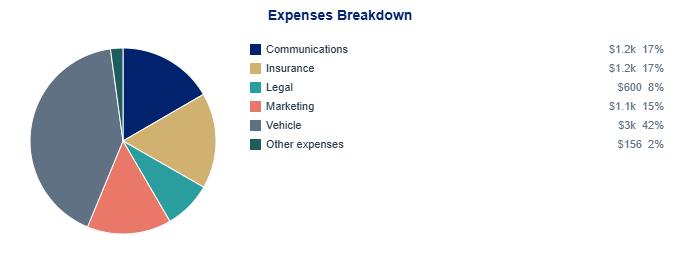
The main annual expenses are vehicle costs ($3,000), communications ($1,200), insurance ($1,200), marketing ($1,056), and legal costs ($600), totalling $7,212 over the year. These are modest relative to revenue, which is a key advantage of the mobile cart model.
Cash Flow
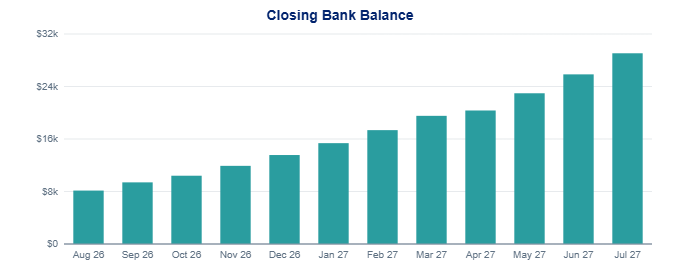
The tightest point for cash occurs in August 2026, when closing cash sits at $8,314. While this is comfortably above zero, it underscores the importance of building reserves early. From that point, closing cash rises each month, reaching $32,671 by July 2027.
Other Transactions
The forecast also accounts for a net $2,000 cash inflow from asset transactions, and GST collected on sales contributing a further $6,244 inflow. Offsetting these are $2,642 in GST paid on purchases and $1,935 in GST payments, both representing cash leaving the business.
Graphs